ఎం కోటేశ్వరరావు
అమెరికా, ఆస్ట్రేలియా వంటి ధనిక దేశాలు దౌత్యపరంగా మనకు మిత్ర దేశాలే. మన యువతీ యువకులు తెల్లారి లేస్తే ఏదో ఒక చోటికి వెళ్లాలని తహతహలాడుతుంటారు. మన పాలకులు అక్కడికి వెళ్లినపుడు, వారు ఇక్కడికి వచ్చినపుడు భారత దేశమా చుట్టుపక్కల 66 దేశాలకు పోతుగడ్డ అన్నట్లుగా మాట్లాడతారు. ఇది నాణానికి ఒకవైపు మాత్రమే. రెండోవైపు చూస్తే ఎక్కడన్నా బావే కానీ వంగతోట దగ్గర కాదన్నట్లు, మీ ఇంటికొస్తే మాకేం పెడతావ్, మా ఇంటికొస్తూ మాకేం తెస్తావ్ అన్నట్లుగా తమ దేశాల కార్పొరేట్ల ప్రయోజనాల విషయంలో మనకు ముఖ్యంగా రైతాంగానికి అవి శత్రుదేశాలే. ప్రపంచీకరణ పేరుతో మన పెట్టుబడిదారులు ఇతర దేశాలకు విస్తరించేందుకు, ఇప్పటికే విస్తరించిన బహుళజాతి కంపెనీలతో జత కట్టేందుకు మన పాలకవర్గం ప్రపంచీకరణ పేరుతో వాటికి ప్రాతినిధ్యం వహించే సంస్ధల సలహాలు, ఆదేశాలతో నడుస్తున్నాయి. దానిలో భాగంగానే ఇప్పటికే మన పాలకులు ఒక్కొక్క వలువ తీసివేసి చివరకు గోచి మీద నిలబెట్టినట్లు నామ మాత్ర రాయితీలు మిగిల్చాయి. ఇప్పుడు రైతాంగానికి మిగిలిన ఆ గోచిని కూడా తీసేయాల్సిందేనని ధనిక దేశాలు డిమాండ్ చేస్తున్నాయంటే నమ్ముతారా? ఇప్పుడు ఆ పంచాయతీ ప్రపంచ వాణిజ్య సంస్ధలో నడుస్తోంది.
అమెరికాాచైనా మధ్య జూలైలో ప్రారంభమైన వాణిజ్య యుద్ధం గురించి మాత్రమే మనకు తెలుసు. ఆ యుద్దంలో దెబ్బతినే తన రైతాంగానికి ఇప్పటికే ఇస్తున్న సబ్సిడీలకు తోడు అదనంగా పత్తి, సోయా వంటి అనేక ఎగుమతి పంటలకు 12బిలియన్ డాలర్లు ఇవ్వాలని నిర్ణయించింది అమెరికా. అలాంటి దేశం గతంలో వరి, గోధుమలపై ఇప్పుడు మన మీద పత్తి రాయితీలు పరిమితికి మించి ఇస్తున్నారంటూ కనీస మద్దతు ధరకు ఎసరు పెట్టింది. తప్పుడు లెక్కలతో ప్రపంచ వాణిజ్య సంస్ధ(డబ్ల్యుటివో)కు ఫిర్యాదు చేసింది. చెరకు రైతులకు, పంచదార ఎగుమతులకు ఇస్తున్న సబ్సిడీలు తమ రైతాంగాన్ని, మొత్తంగా ప్రపంచ పంచదార మార్కెట్ను దెబ్బతీశాయంటూ ఆస్ట్రేలియా కూడా అదే పని చేసింది. ఆ వాదన లేదా మనపై దాడికి ప్రాతిపదిక ఏమిటి? మన దేశంలో వున్న విభిన్న వాతావరణ పరిస్ధితుల కారణంగా అటు వుష్ణ మండల పంటలతో పాటు ఇటు శీతల మండల, సమశీతల మండల ప్రాంతాలలో సాగు చేసే పంటలలో కొన్ని మినహాదాదాపు అన్నింటినీ పండించే అవకాశం వుంది. అందుకే మన దేశాన్ని తన పరిశ్రమలకు ముడిసరకు సరఫరా చేసే ప్రాంతంగా పారిశ్రామిక విప్లవం తరువాత ఐరోపా ధనిక దేశాలు గుర్తించాయి. అందుకే ఆక్రమణ పోటీలో బ్రిటన్ది పైచేయి అయింది.మారిన పరిస్ధితుల్లో తమ అన్ని రకాల వ్యాపారాలు, వస్తుమార్కెట్లకు మన దేశం అనువుగా వుంది కనుక, భౌతికంగా ఆక్రమించుకొనే అవకాశం లేదు గనుక మన మార్కెట్ను ఆక్రమించుకొనేందుకు, తమకు అనుకూలంగా మన విధానాలను రూపుదిద్దేందుకు పూనుకున్నాయి. అందుకోసం ప్రపంచీకరణ, సరళీకరణ, సంస్కరణలు అంటూ ముద్దుపేర్లను ముందుకు తెచ్చాయి. ప్రస్తుతాంశం వ్యవసాయ సబ్సిడీలు కనుక వాటి గురించి చూద్దాం.
గత రెండు దశాబ్దాలలో మన వ్యవసాయ పెట్టుబడులు కనీసంగా నాలుగింతలు పెరిగాయి. ప్రపంచ వాణిజ్య సంస్ధ(డబ్ల్యుటిఓ) వునికిలో వచ్చి జనవరి ఒకటిన 24వ సంవత్సరంలో అడుగిడబోతోంది. ముఫ్పై సంవత్సరాల నాటి లెక్కల ఆధారంగా వర్ధమాన దేశాలకు నిర్ణయించిన పదిశాతం సబ్సిడీ పరిమితిని, వ్యవసాయ వుత్పత్తుల ధరలను పరిగణనలోకి తీసుకొని ఇప్పుడు భారత్లో సబ్సిడీలు పరిమితికి మించి ఇస్తున్నారని అమెరికా, ఆస్ట్రేలియాలు ఫిర్యాదు చేశాయి. కనీస మద్దతు ధర ఆ నిబంధనను వుల్లంఘించేదిగా వుందని, తగ్గించాలని డిమాండ్ చేస్తున్నాయి. సరే అసలు ఎత్తివేయాలని కూడా మరోవైపు వత్తిడి తెస్తున్నాయనుకోండి. దీన్ని సులభంగా అర్ధం చేసుకోవాలంటే మన దేశంలో వుత్పత్తి అయ్యే మొత్తం పత్తి విలువ వెయ్యికోట్ల రూపాయలు అనుకుందాం. ప్రపంచ వాణిజ్య సంస్ధ నిబంధనలు, అమెరికా, ఆస్ట్రేలియా, కెనడా, ఐరోపాయూనియన్ వంటి ధనిక దేశాల వాదన ప్రకారం పత్తి మీద సబ్సిడీ మొత్తం విలువలో పదిశాతం అంటే వంద కోట్ల రూపాయలకు మించి ఇవ్వకూడదు. దీన్నే మరొక విధంగా చెప్పాలంటే కనీస మద్దతు ధరల పెంపుదల వందకోట్ల రూపాయలకు మించకూడదు.(ప్రత్యక్షంగా ఇచ్చే సబ్సిడీ మొత్తాలకు, కనీస మద్దతు ధరల సబ్సిడీ అవగాహనకు వున్న తేడా తెలిసిందే) మిగతా పంటలకూ ఇదే సూత్రం. ప్రపంచ వాణిజ్య సంస్ధ వునికిలోకి రాక ముందు దాని విధి విధానాలను రూపొందించే కసరత్తులో భాగంగా 1986-88 సంవత్సరాలలో ప్రపంచ మార్కెట్లో వున్న సగటు ధరలను ప్రాతిపదికగా తీసుకొని ధనిక దేశాలు ఐదుశాతం, అభివృద్ధి చెందుతున్న దేశాలు పదిశాతానికి మించి సబ్సిడీలు ఇవ్వకూడదని నిర్ణయించారు.
అంకెలతో ఎన్నో గారడీలు చేయవచ్చు. స్వామినాధన్ కమిటి సిఫార్సుల ప్రకారం వుత్పాదక ఖర్చుకు అదనంగా సగం కలిపి అంటే 150 గా కనీస మద్దతు ధరలను నిర్ణయిస్తామని కేంద్ర ప్రభుత్వం ప్రకటించింది. వుత్పాదక ఖర్చులో కొన్నింటిని కలపలేదని మనం విమర్శిస్తున్నాం. అంతకంటే ముందే మన మద్దతు ధరలను వ్యతిరేకిస్తున్న అమెరికా ఏమి చెబుతోందో చూద్దాం. మన గోధుమలు, వరికి ప్రకటిస్తున్న మద్దతు ధర పదిశాతం పరిమితికి మించి 60,70 శాతం వుందని అమెరికా వాణిజ్య ప్రతినిధి ప్రపంచ వాణిజ్య సంస్ధకు ఫిర్యాదు చేశాడు. గాజు కొంపలో కూర్చొని ఎదుటివారి మీద రాళ్లు వేస్తున్నది అమెరికా. మన దేశం వరికి 60శాతం అదనంగా ఇస్తున్నట్లు యాగీ చేస్తున్న ఆ దేశం తన రైతాంగానికి 82శాతం, ఐరోపా యూనియన్ 66శాతం ఇస్తున్నది. ప్రపంచ వాణిజ్య సంస్ధ సూత్రాల ప్రకారం మొత్తం వ్యవసాయ పంటల విలువలో ధనిక దేశాలు ఐదుశాతం, అభివృద్ధి చెందుతున్న దేశాలు పదిశాతం పరిమితికి సబ్సిడీలు మించకూడదు. అయితే దీన్ని వక్రీకరించి కొన్ని పంటలకు కొన్ని సంవత్సరాలలో విపరీతమైన సబ్సిడీలను ఇచ్చి మొత్తం పంటల విలువకు దాన్ని వర్తింప చేసి ధనిక దేశాలు తప్పించుకుంటున్నాయి. అందుబాటులో వున్న సమాచారం మేరకు కొన్ని సంవత్సరాలలో అమెరికాకు అర్హత వున్న సబ్సిడీ మొత్తం వంద రూపాయలు అనుకుంటే 90రూపాయలను పాలు, పంచదార రైతులకే ఇచ్చింది, అలాగే ఐరోపా యూనియన్ 64రూపాయలను గోధుమ, వెన్నకే ఇచ్చింది.
గత ఇరవై ఏండ్లలో ఏడు సంవత్సరాల సమాచారాన్ని చూసినపుడు అమెరికాలో కొన్ని వుత్పత్తులకు వూలు 215, మేక బచ్చుతో చేసే శాలువలకు 141, వరి 82, పత్తి 74, పంచదార 66, కనోలా 61, ఎండు బఠాణీలకు 57శాతం, ఐరోపా యూనియన్లో పట్టుపురుగులకు 167, పొగాకు 155, పంచదార 120, కీరా 86, పియర్స్ పండ్లకు 82, ఆలివ్ ఆయిల్ 76, వెన్న 71,ఆపిల్స్ 68,పాలపొడి 67,టమాటా 61శాతాల చొప్పున ఇచ్చారు. ఇలా ప్రత్యేకించి ఒక వుత్పత్తికి ఇచ్చిన రాయితీలు సబ్సిడీల పరిధిలో చూపటం లేదు.
మన దేశం 53ా81శాతం మధ్య పత్తికి సబ్సిడీ ఇస్తున్నట్లు అమెరికా ఆరోపించింది. కాటన్ కార్పొరేషన్ ఆఫ్ ఇండియా చేసిన కొనుగోళ్లను మాత్రమే సబ్సిడీలుగా భారత్ చూపుతున్నది.2015ా16లో 120 కోట్ల రూపాయలు చెల్లించినట్లు ప్రపంచ వాణిజ్య సంస్ధకు భారత్ తెలిపిందని అయితే 50,400 కోట్ల రూపాయలు చెల్లించినట్లు అమెరికా ఆరోపించింది. అంటే మొత్తం పత్తిని ప్రభుత్వమే కొనుగోలు చేసినట్లు రైతులకు సబ్సిడీ ఇచ్చినట్లు చిత్రించింది. పంచదారను ప్రభుత్వం సేకరించే విధానం లేనప్పటికీ మద్దతు ధర నిర్ణయించటమే సబ్సిడీ చెల్లించటంగా ఆస్ట్రేలియా ఆరోపించింది. తాము నిర్ణయిస్తున్న మద్దతు ధరలను డబ్ల్యుటిఓ ఏర్పాటుకు ముందు 1986ా88 నాటి ధరలతో పోల్చి ఎక్కువగా వుంటున్నట్లు అమెరికా తప్పుడు లెక్కలు వేస్తోందని మన దేశం గతంలోనే సమాధానమిచ్చినా ఖాతరు చేయకుండా ఫిర్యాదు చేశారు. భారత్ డాలర్లలో లెక్కలు వేస్తుంటే అమెరికన్లు భారతీయ కరెన్సీలో గుణిస్తున్నారని అందువలన ఇరు దేశాలు చెప్పేదానికి పొంతన వుండదని పరిశీలకులు వ్యాఖ్యానిస్తున్నారు. 1990లో ఒక డాలరుకు 18 రూపాయలుండగా ఇప్పుడు 72 తాకింది. అందువలన రూపాయల్లో లెక్కవేసినపుడు నాలుగు రెట్లు ఎక్కువగా కనిపించటం సహజం. భారత, చైనా వంటి దేశాల వ్యవసాయ సబ్సిడీల గురించి అభ్యంతర పెడుతున్న ధనిక దేశాలు తాము ఇస్తున్నవాటి గురించి దాస్తున్నాయి. పలు ఖాతాల ద్వారా అందచేస్తూ వాటిని సబ్సిడీలుగా పరిగణించకుండా జాగ్రత్త పడుతున్నాయి.
అంతర్జాతీయ పత్తి సలహా సంస్ధ 2018 నవంబరులో విడుదల చేసిన ఒక నివేదికలో పేర్కొన్న అంశాలను గమనించటం అవసరం. కనీస మద్దతు ధరలు, ప్రత్యక్ష వుత్పాదక సబ్సిడీ, బీమా, తదితర రాయితీలన్నింటినీ కలిపి మొత్తంగా పత్తి సబ్సిడీలని పిలుస్తున్నారు.ప్రపంచ వ్యాపితంగా ఇవి 2016-17లో 4.4బిలియన్ డాలర్లుండగా 2017-18నాటికి 5.9బిలియన్లకు( ఒక బిలియన్ వంద కోట్ల డాలర్లు) 33శాతం పెరిగాయి. ఒక పౌను(453) దూదికి ఇచ్చిన సబ్సిడీ 17 నుంచి 18 సెంట్లకు(నవంబరు 27 విలువ ప్రకారం రు.12.03 నుంచి రు.12.74కు పెరిగాయి) 1997-98 నుంచి ఇప్పటి వరకు వున్న ధోరణుల ప్రకారం పత్తి ధరలు ఎక్కువగా వున్నపుడు సబ్సిడీలు తగ్గటం, తగ్గినపుడు పెరుగుదల వుంది.
పత్తి ధరల విషయానికి వస్తే 2013-14లో సగటున పౌనుకు 91సెంట్లు లభిస్తే 2014-16లో 70కి తగ్గి 2016-17లో 83కు, 2017-18లో 88 సెంట్లకు పెరిగింది.బ్రెజిల్,భారత్,పాకిస్ధాన్ వంటి అనేక దేశాలలో 2017-18లో కనీస మద్దతు ధరల కంటే మార్కెట్లో ఎక్కువ ధరలు వున్నాయి. అయినప్పటికీ కొన్ని దేశాలు ఎరువులు, రవాణా, గ్రేడింగ్, నిల్వ, ఇతర మార్కెటింగ్ ఖర్చులను సబ్సిడీగా ఇచ్చాయి.కొన్ని చోట్ల పంటల బీమా సబ్సిడీ పెరిగింది.1998-2008 మధ్య ప్రత్యక్ష, ఇతర సబ్సిడీల మొత్తం సగటున 55శాతం పెరిగింది, మరుసటి ఏడాది 83శాతానికి చేరింది, 2010-14 మధ్య 48శాతానికి తగ్గింది, తదుపరి రెండు సంవత్సరాలలో సగటున 75శాతానికి పెరిగి తదుపరి రెండు సంవత్సరాలలో 47శాతానికి తగ్గాయి. ఈ పూర్వరంగంలో చూసినపుడు మన దేశం గురించి అమెరికా చేసిన ఫిర్యాదు దురుద్దేశపూరితం, కనీస మద్దతు ధర వంటి కనీస రక్షణ కూడా ఎత్తివేయాలని వత్తిడి చేయటం తప్ప మరొకటి కాదు. చైనా, అమెరికాలలో మాదిరి వివిధ పధకాల కింద ఇస్తున్న రాయితీలు మన పత్తి రైతాంగానికి లేవు. ఎరువులు, పురుగు మందుల ధరల మీద నియంత్రణ ఎత్తివేయటం, పెరిగిన ధరలకు అనుగుణంగా సబ్సిడీ మొత్తాన్ని పెంచకపోవటం వంటి చర్యల కారణంగా పత్తి రైతాంగానికి ఏటే వుత్పాదక ఖర్చు పెరిగిపోతోంది. కనీస మద్దతు ధరకంటే పడిపోయినపుడు రంగంలోకి వస్తున్న సిసిఐ పరిమితంగానే కొనుగోళ్లు చేస్తూ ప్రయివేటు వ్యాపారులకు ఎక్కువగా తోడ్పడుతోంది. అనేక సందర్భాలలో రైతుల పేరుతో వ్యాపారుల నుంచే కొనుగోలు చేసిన కుంభకోణాల గురించి పత్తి రైతాంగానికి తెలిసిందే.
అమెరికా అభ్యంతర పెడుతున్న కనీస మద్దతు ధరల ప్రహసనం ఏమిటో మనకు తెలియంది కాదు. అంతర్జాతీయ పత్తి సలహా సంస్ధ నివేదిక రహస్యమేమీ కాదు. దానిలో మన దేశం గురించి పేర్కొన్న అంశాలు ఇలా వున్నాయి.’ భారత్లో కనీస మద్దతు ధర పద్దతి వుంది. 2014-15 మరియు 2015-16 సంవత్సరాలలో కనీస మద్దతు ధరల కంటే మార్కెట్ ధరలు తక్కువగా వున్నందున కొద్ది కాలమైనా ప్రభుత్వం నేరుగా పత్తి కొనుగోలు చేసింది.2016-17,2017-18లో మార్కెట్ ధరలు ఎక్కువగా వున్నందున మద్దతు ధరల వ్యవస్ధ కొనుగోలు అవసరం లేకపోయింది. మధ్యరకం పింజ రకమైన జె34 రకానికి 2017-18లో మద్దతు ధరగా క్వింటాలుకు రు.4,020 నిర్ణయించారు. అది పౌను దూది ధర 83సెంట్లకు సమానం. భారత్లో పత్తి రైతులు ప్రభుత్వ రుణ మాఫీ మరియు ఎరువుల సబ్సిడీ వలన లబ్ది పొందారు. పంటల బీమా ద్వారా కూడా కొంత మేర మద్దతు ఇచ్చారు. అయితే దీని విలువ ఎంతో తెలియదు. ఇది కాకుండా నాణ్యమైన విత్తనాల వుత్పత్తికి అవసరమైన మౌలిక సదుపాయాలు కల్పించటం వంటి కార్యక్రమాలను ప్రభుత్వం అమలు చేస్తోంది. టెక్నాలజీ మిషన్ ద్వారా జిన్నింగ్, ప్రెస్సింగ్ యూనిట్ల నవీకరణకు, పత్తి మార్కెటింగ్కు ఇటీవల తోడ్పడింది. వీటి గురించి బహిరంగంగా తెలిపే సమాచారం లేదు. ఇవి గాకుండా జౌళి రంగానికి ప్రత్యక్ష మద్దతు, చౌక రుణాల ద్వారా కూడా ప్రభుత్వం మద్దతు ఇస్తోంది.’ రుణాల రద్దును, నూలు, వస్త్ర మిల్లులకు ఇస్తున్న రాయితీలను కూడ పత్తి రైతులకు ఇస్తున్న రాయితీగా చిత్రించారు.
చైనా పత్తి రైతులకు ఇస్తున్న రాయితీల గురించి చూద్దాం. 2017-18లో అంతకు ముందు ఏడాది ఇచ్చిన 3.3బిలియన్ డాలర్ల సబ్సిడీని 4.3బిలియన్ డాలర్లకు పెంచారు(పౌనుకు 30సెంట్లు). ప్రపంచ వాణిజ్య ఒప్పందం ప్రకారం దిగుమతి చేసుకోవాల్సిన నిర్దేశిత వంతుకు మించి అదనంగా దిగుమతి చేసుకొనే పత్తి మీద 40శాతం పన్నుతో సహా రైతాంగానికి పలు రక్షణలు కల్పిస్తున్న కారణంగా అంతర్జాతీయ మార్కెట్ ధరకంటే రైతాంగానికి ఎక్కువ గిట్టుబాటు అవుతున్నది. దిగుమతి చేసుకున్న పత్తి ధర, చైనా మిల్లులకు చేరిన ధరకు మధ్య వున్న వ్యత్యాసం రైతులకు నష్టదాయకంగా వుండకుండా చూసేందుకు చెల్లించిన లబ్ది మొత్తం 201-17లో ఒక బిలియన్ డాలర్లు వుండగా మరుసటి ఏడాది అది 1.5బిలియన్లకు పెరిగింది. ఇంతేగాకుండా మన దగ్గర కనీస మద్దతు ధర మాదిరిగా ప్రతి ఏటా రైతాంగానికి ఒక లక్షిత ధరను ప్రభుత్వం ప్రకటిస్తుంది. ఆ ఏడాది మార్కెట్లో వచ్చిన సగటు ధరతో దానిని పోల్చి తక్కువ వస్తే ఆ మేరకు రైతులకు ప్రభుత్వం నేరుగా చెల్లిస్తుంది. ఆ మేరకు 2015,16,17 సంవత్సరాలలో చెల్లింపులు చేసింది. 2018 సంవత్సరానికి ఒక టన్నుకు 18,600 యువాన్లుగా నిర్ణయించింది. ఇది పౌనుకు 130 సెంట్లకు సమానం. దాని ప్రకారం అంతకు ముందు సంవత్సరం చెల్లించిన 1.6బిలియన్ల నుంచి 2.1బిలియన్లకు మొత్తాన్ని పెంచింది. అంతే కాదు ప్రతి ఏటా 15క్లో డాలర్ల మేర నాణ్యమైన విత్తన సబ్సిడీ, మరో 15కోట్ల డాలర్లను దూర ప్రాంత రవాణా ఖర్చుల కింద రైతాంగానికి చెల్లించింది. ప్రపంచ వాణిజ్య సంస్ధలో సభ్యత్వం కోసం చైనా కుదుర్చుకున్న ఒప్పందం మేరకు ఒక ఏడాదికి 8,94,000 టన్నుల పత్తి దిగుమతి చేసుకుంటే దాని మీద పన్ను ఒక శాతమే విధించాలి. అంతకు మించి దిగుమతులు వుంటే పరిమాణాన్ని బట్టి ఒక శాతం నుంచి 40శాతం వరకు పన్ను విధించవచ్చు. గత మూడు సంవత్సరాలుగా నిర్దేశిత మొత్తం మేరకే దిగుమతులు చేసుకుంటున్నది.

కాటన్ కార్పొరేషన్ ఆఫ్ ఇండియా(సిసిఐ) వార్షిక నివేదికలను ఆ సంస్ధ వెబ్ సైట్లో ఎవరైనా చూడవచ్చు. వాటిలో పేర్కొన్నదాని ప్రకారం 2014-15 సంవత్సరానికి పత్తి కనీస మద్దతు ధర అంతకు ముందు సంవత్సరం కంటే పెంచింది రు.50, ఇది ఒక శాతానికి దగ్గరగా వుంది. అంతర్జాతీయ మార్కెట్లో డిమాండ్ పడిపోయిన కారణంగా ఆ ఏడాది దేశీయ మార్కెట్లో ముడిపత్తి ధరలు అంతకు ముందు సంవత్సరంతో పోలిస్తే 19 నుంచి 30శాతం వరకు, అదే విధంగా దూది ధర 25 నుంచి 30శాతం వరకు పతనమైందని సిసిఐ నివేదిక తెలిపింది. ఇలాంటి సందర్భాలలో చైనా, అమెరికాలలో రైతాంగానికి ఆయా ప్రభుత్వాలు సబ్సిడీల రూపంలో నష్టం రాకుండా చూశాయి. మన దేశంలో అలాంటి విధానం లేదు. కనీస మద్దతు ధరకంటే మార్కెట్లో తక్కువ వున్నపుడు ఇష్టం లేని పెండ్లికి తలంబ్రాలు పోసినట్లుగా సిసిఐ కొనుగోళ్లు వుంటున్నాయి. అవి కూడా మద్దతు ధరకు మించటం లేదు. పైన చెప్పుకున్నట్లు ఒక ఏడాది ధరలు భారీగా పడిపోయినా రైతాంగం అప్పులపాలు కావాల్సిందే. ఈ ఏడాది ప్రస్తుతం మార్కెట్లో కనీస మద్దతు ధరల కంటే తక్కువ ధరలకే అధిక మొత్తాలను కొనుగోలు చేస్తున్నట్లు వివిధ మార్కెట్ల సమాచారం వెల్లడిస్తున్నది.
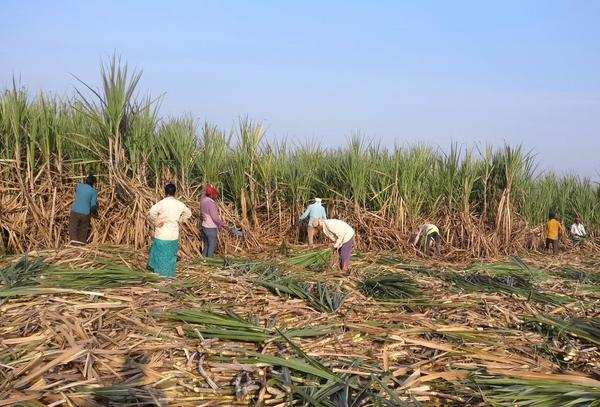
1966 నాటి చెరకు నియంత్రణ విధానం ప్రకారం మన ప్రభుత్వాలు చెరకు ధరను సూచిస్తున్నాయి. ఈ విధానం, పంచదార ఎగుమతులకు ఇస్తున్న రాయితీల కారణంగా ధరలు తగ్గి తమతో పాటు ప్రపంచ రైతాంగానికి, వ్యాపారులకు నష్టం జరుగుతోందంటూ ఆస్ట్రేలియా ప్రపంచ వాణిజ్య సంస్ధకు మన దేశం మీద చేసిన పరోక్ష ఫిర్యాదును ఇప్పుడు విచారిస్తున్నారు.’ చెరకు వుత్పాదనా సామర్ధ్యాన్ని పెంచేందుకు భారతీయ రైతులకు అధిక మూల్యం చెల్లిస్తున్నారు.దీంతో పంచదార మిల్లులకు ప్రభుత్వం అదనంగా చెల్లించేందుకు వీలు కలుగుతోంది. ప్రపంచ వాణిజ్య ఒప్పందం ప్రకారం భారత్ సబ్సిడీలను తగ్గించే జాబితాలో చెరకు లేదు ‘ అని ఆస్ట్రేలియా ఫిర్యాదు చేసింది. చెరకు సబ్సిడీలను తగ్గిస్తామని అంగీకరించిన దేశాలలో మన దేశం లేదు. ధనిక దేశాలు కోరుతున్న పద్దతిలో వ్యవసాయ సబ్సిడీలను తగ్గించాలనటాన్ని మనదేశం, చైనా వుమ్మడిగా ప్రపంచ వాణిజ్య సంస్ధలో వ్యతిరేకించాయి, ఈ అంశం మీద చర్చలు జరపాలని డిమాండ్ చేశాయి. అయితే అమెరికా, ఐరోపాయూనియన్, జపాన్, నార్వే, స్విడ్జర్లాండ్ తదితర దేశాలు చర్చను తీవ్రంగా వ్యతిరేకిస్తున్నాయి. 2011-17 మధ్య అంగీకరించిన సబ్సిడీ మొత్తాలకు మించి చెరకు సబ్సిడీలను భారత్లో ఇచ్చారని ఆస్ట్రేలియా వాదించింది. భారత చెరకు, పంచదార గురించి అమెరికా తయారు చేసిన తప్పుడు లెక్కలను వుదహరించి ఆస్ట్రేలియా కేసు దాఖలు చేసింది. ఒక్క చెరకు పంట మీదే కాదు, పప్పుధాన్యాలకు కూడా భారత్ ఇస్తున్న సబ్సిడీ వలన కూడా ప్రపంచ వాణిజ్యం ప్రభావితం అవుతోందని ఆరోపిస్తోంది.ఈ వైఖరి ఒక విధంగా మన దేశ సార్వభౌమత్వాన్నే సవాలు చేయటంగా కూడా చెప్పవచ్చు.
ప్రభుత్వం ఇస్తున్న సబ్సిడీల కారణంగా ఈ ఏడాది భారత్లో పంచదార వుత్పత్తి ఏకంగా 20 నుంచి 35 మిలియన్ టన్నులకు పెరిగిందని ఆస్ట్రేలియా ఆరోపించింది. భారత్ 85కోట్ల డాలర్ల మేర సబ్సిడీ ఇచ్చి ఐదులక్షల టన్నుల పంచదారను ప్రపంచ మార్కెట్లో కుమ్మరిస్తున్నదని, తమ దేశంలో టన్ను పంచదార వుత్పత్తికి 440-450 డాలర్ల వరకు ఖర్చవుతుండగా మార్కెట్లో 500డాలర్లుగా వున్న ధర పడిపోయి 400కు మించి రావటం లేదని ఆస్ట్రేలియా ఆరోపిస్తోంది. మరోవైపు మన దేశంలో ప్రస్తుతం కేంద్ర ప్రభుత్వం సూచిస్తున్న ధరలు రైతాంగానికి గిట్టుబాటు కావటం లేదని పెంచాలని కోరుతున్నారు. దీన్నే సబ్సిడీ చెల్లించటంగా చిత్రిస్తున్నారు.నిజానికి రాష్ట్రం లేదా కేంద్రంగానీ రైతులకు ఇస్తున్న ప్రోత్సాహక ధరలు లేదా రాయితీలు చెరకు-దాని వుత్పత్తుల మీద వచ్చే ఆదాయం, పన్నులతో పోల్చుకుంటే తక్కువే. ఈ మాత్రపు రక్షణ కూడా లేకుండా మార్కెట్ శక్తులకు వదలి వేయాలని అంతర్జాతీయ బడా పంచదార వ్యాపారులు వత్తిడి తెస్తున్నారు.
గత పదహారు సంవత్సరాలలో తొలిసారిగా భారత్ పంచదార వుత్పత్తిలో బ్రెజిల్ను అధిగమించి 35.9 మిలియన్ టన్నులతో ప్రధమ స్ధానంలోకి వచ్చింది. అయితే ఇది తాత్కాలికమే అని చెప్పవచ్చు. బ్రెజిల్లో ప్రతికూల వాతావరణం నెలకొనటం ఒక కారణమైతే, చమురు ధరలు 85డాలర్లకు పెరిగినందున పంచదార బదులు ఎథనాల్ తయారు చేయటం లాభసాటిగా వున్నందున పంచదార వుత్పత్తిని కావాలనే తగ్గించారు. చమురు ధరలు 60డాలర్లకు పడిపోయినందున ఎథనాల్ బదులు పంచదారకు మరలితే మన పరిస్థితి ఇబ్బందుల్లో పడుతుంది. ప్రపంచ వ్యాపితంగా 188.3మిలియన్ టన్నుల పంచదార వుత్పత్తి అవుతుందని అంచనా.
మన మార్కెట్ను బహుళజాతి గుత్త సంస్ధలకు తెరిచిన కారణంగా ఇప్పటికే పత్తి, ఇతర విత్తన రంగం,పురుగు మందుల రంగం విదేశీ, స్వదేశీ గుత్త సంస్ధల ఆధిపత్యంలోకి పోయింది.వారు నిర్దేశించిన ధరలకు కొనుగోలు చేయాల్సిందే. కార్గిల్ వంటి బహుళజాతి గుత్త సంస్ధలు కనీస మద్దతు ధరలను దెబ్బతీసే విధంగా పరోక్షంగా కొనుగోళ్లు జరుపుతూ మార్కెట్లను నిర్దేశిస్తున్నాయని 2017 జనవరిలో వార్తలు వచ్చాయి. లోపాలతో కూడినదే అయినప్పటికీ ఆ విధానం కూడా వుండకూడదని, అప్పుడే తాము ప్రత్యక్షంగా రంగంలోకి దిగవచ్చని అవి భావిస్తున్నాయి. దానిలో భాగంనే పారిశ్రామిక రంగానికి ఇచ్చే రాయితీలను కూడా రైతుల ఖాతాలో వేసి అమెరికా వంటి దేశాలు కనీస మద్దతు ధరల విధానం మీద దాడి చేస్తున్నాయన్నది స్పష్టం. దీని వెనుక అంతర్జాతీయ వ్యవసాయ కార్పొరేట్ల ప్రయోజనాలు తప్ప మరొకటి లేదు. ధనిక దేశాల లాబీ, వత్తిడికి లంగి వాటికి అనుకూలమైన విధానాలు అమలు జరుపుతున్న పాలకవర్గాల మీద, అదే విధంగా కార్పొరేట్ శక్తుల కుట్రల మీద రైతాంగం చైతన్యవంతులై ఆ విధానాలను తిప్పికొట్టకపోతే వున్న రాయితీలు కూడా వూడ్చిపెట్టుకుపోయే ప్రమాదం వుంది.